
Phuket Weather by Month: Rain, Heat and Haze
Phuket's wettest months are September, October and August, with 350.4, 336.0 and 308.7 mm of rain. February is the driest at 24.0 mm. March is the hottest, with a mean daily maximum of 34.4 C. The year totals 2271.5 mm on 174.9 rainy days.
On this page
September is Phuket’s wettest month, with 350.4 mm of rain on 21.7 rainy days. February is the driest, with 24.0 mm on 3.4 rainy days. The table below gives rain, rainy days and temperature for each month.
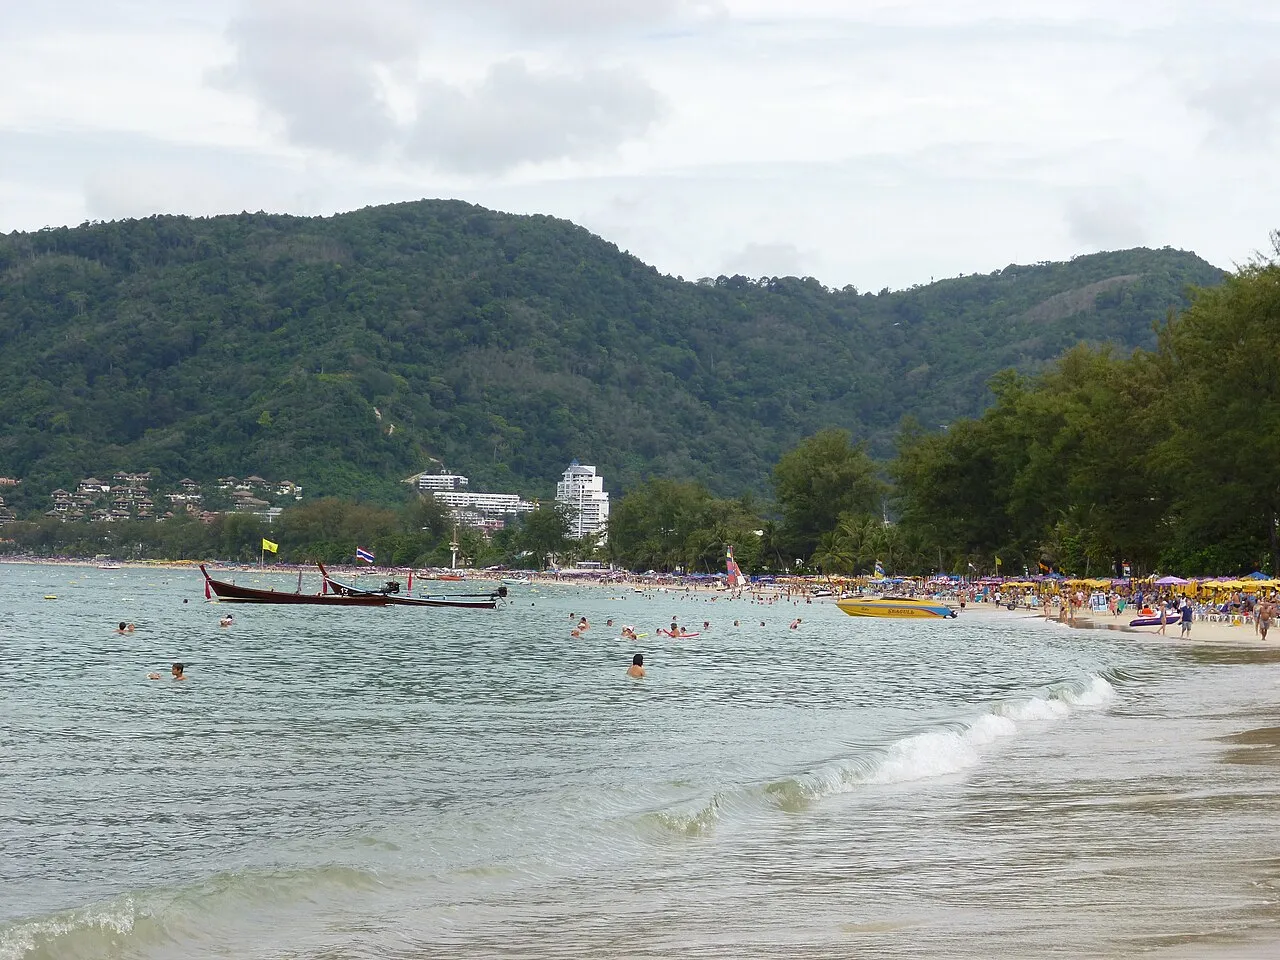
Phuket weather by month
Climate normals for the Phuket station, 1991-2020. Temperatures are daily means in C.
| Month | Rain (mm) | Rainy days | Mean max (C) | Mean min (C) |
|---|---|---|---|---|
| January | 49.9 | 5.6 | 33.0 | 25.0 |
| February | 24.0 | 3.4 | 34.0 | 25.4 |
| March | 80.7 | 7.5 | 34.4 | 25.9 |
| April | 135.1 | 11.7 | 34.2 | 26.3 |
| May | 236.9 | 18.9 | 33.2 | 26.1 |
| June | 249.4 | 18.6 | 32.6 | 25.8 |
| July | 240.2 | 19.1 | 32.3 | 25.6 |
| August | 308.7 | 19.5 | 32.2 | 25.6 |
| September | 350.4 | 21.7 | 31.8 | 25.1 |
| October | 336.0 | 22.7 | 31.8 | 24.9 |
| November | 178.2 | 15.9 | 32.1 | 25.2 |
| December | 82.0 | 10.3 | 32.1 | 25.0 |
| Year | 2271.5 | 174.9 | 32.8 | 25.5 |
Rain jumps in May, from 135.1 mm in April to 236.9 mm. The yearly mean temperature is 28.5 C.
Dry, wet and in between
The rainy season runs from around mid-May to mid-October. In a normal year the daily rain record puts the start at 28 April and the end at 17 November.
- January to April: monthly rain runs from 24.0 to 135.1 mm.
- May to October: monthly rain runs from 236.9 to 350.4 mm.
- November and December: rain falls from 178.2 mm to 82.0 mm.
The heaviest single day on record in each month ranges from 83.2 mm in January to 180.7 mm in October.

Heat and humidity
March is the hottest month, with a mean daily maximum of 34.4 C, and April follows at 34.2 C. The mean daily minimum runs from 24.9 C in October to 26.3 C in April.
Mean humidity rises from 69% in February to 82% in October. Mean daily maximum humidity reaches 93% in September and October.
Haze and thunderstorms
Haze days peak in the dry months. Rainy days and thunderstorm days follow the monsoon.
| Month | Haze days | Thunderstorm days |
|---|---|---|
| January | 4.9 | 1.4 |
| February | 5.2 | 0.9 |
| March | 6.5 | 3.9 |
| April | 3.8 | 7.5 |
| May | 0.6 | 6.3 |
| June | 0.3 | 3.5 |
| July | 0.5 | 3.6 |
| August | 0.5 | 2.6 |
| September | 0.8 | 2.5 |
| October | 1.4 | 4.8 |
| November | 2.3 | 4.8 |
| December | 4.8 | 1.8 |
| Year | 31.6 | 43.6 |
March has the most haze, at 6.5 days. April has the most thunderstorm days, at 7.5.
Sea and beaches by season
Swimming at Nai Harn is not recommended from May to October due to strong current. Surin Beach is not suitable for swimming in the monsoon season.
Karon has a rainy season from April to November, and its beach has fairly strong waves and winds. Box jellyfish are more commonly seen during the monsoon months.
Avoid swimming in the sea after heavy rain, at night, or outside designated safety zones marked by buoys. Read jellyfish and rip currents in Phuket before your first swim, and compare beaches in Phuket beaches compared.

Plan your months
- Beach days: pick January to April, when monthly rain runs from 24.0 to 135.1 mm.
- Fewest rainy days: February has 3.4.
- Midday heat: March and April have the highest mean daily maximums, 34.4 C and 34.2 C.
- Haze: March has the most haze days, at 6.5.
- Wettest stretch: August, September and October get 308.7, 350.4 and 336.0 mm.
For today’s forecast, open the live forecast. For the dates and sea detail of the monsoon, read the Phuket rainy season guide.

Photo credits
- Patong Bay under a cloudy sky: Wikimedia Commons, Patong Beach Phuket November 2012 (Arnaud-Victor Monteux, CC BY-SA 4.0) (opens in a new tab) (CC BY-SA 4.0 (Arnaud-Victor Monteux))
- Kata Beach with Ko Pu on the horizon: Wikimedia Commons, Kata Beach view (HutheMeow, CC BY-SA 4.0) (opens in a new tab) (CC BY-SA 4.0 (HutheMeow))
- Karon Beach: Wikimedia Commons, Karon Beach,Phuket (5) (Kasintorn Rachaorot, CC BY-SA 4.0) (opens in a new tab) (CC BY-SA 4.0 (Kasintorn Rachaorot))
- The bay at Surin Beach seen from under a palm: Wikimedia Commons, Surin Beach, Phuket, Thailand 2016 (::::=UT=::::, CC BY-SA 3.0) (opens in a new tab) (CC BY-SA 3.0 (::::=UT=::::))
Not confirmed: Sea state, waves and storm warnings on a given day: climate normals do not give them, so check the live forecast before you go out.
Common questions
Which month is the wettest in Phuket?
September, with 350.4 mm of rain on 21.7 rainy days.
Which month is the driest in Phuket?
February, with 24.0 mm of rain on 3.4 rainy days.
When is the rainy season in Phuket?
Around mid-May to mid-October, when the southwest monsoon covers Phuket.
How much rain does Phuket get in a year?
About 2271.5 mm on 174.9 rainy days.
Which is the hottest month?
March, with a mean daily maximum of 34.4 C.
How humid is it in the rainy season?
Mean humidity is 81% in September and 82% in October.
When is haze most common?
March has the most haze days at 6.5, then February at 5.2 and January at 4.9.
How many thunderstorm days does Phuket have?
43.6 a year, with the most in April at 7.5.
Is swimming safe in the rainy season?
Swimming at Nai Harn is not recommended from May to October, and Surin Beach is not suitable for swimming in the monsoon season.
Read next
General information checked against the sources listed above, not legal advice for your situation. Rules and office practice change; confirm with the immigration office or a licensed adviser before you act. See how guides are checked.
Spotted an error? Report it.
Comments (0)
Be the first to ask about this topic.